
Marketing campaign performance measurement is the process of evaluating how well your marketing efforts achieve defined business goals using specific metrics and analytical frameworks. Marketers who skip this step spend budgets without knowing what actually works. The core tools are KPIs, ROI formulas, and incrementality testing. Industry bodies like the IAB and platforms like HubSpot have published standards that give teams a repeatable way to track campaign effectiveness and connect spending to real revenue. This guide gives you a practical framework to do exactly that.
What key metrics should you track to measure marketing campaign performance?
The metrics you track determine the quality of every decision you make. Vanity metrics like impressions and follower counts feel good but rarely connect to revenue. The metrics below are the ones that actually reflect campaign impact.
Financial metrics show whether the campaign paid for itself:
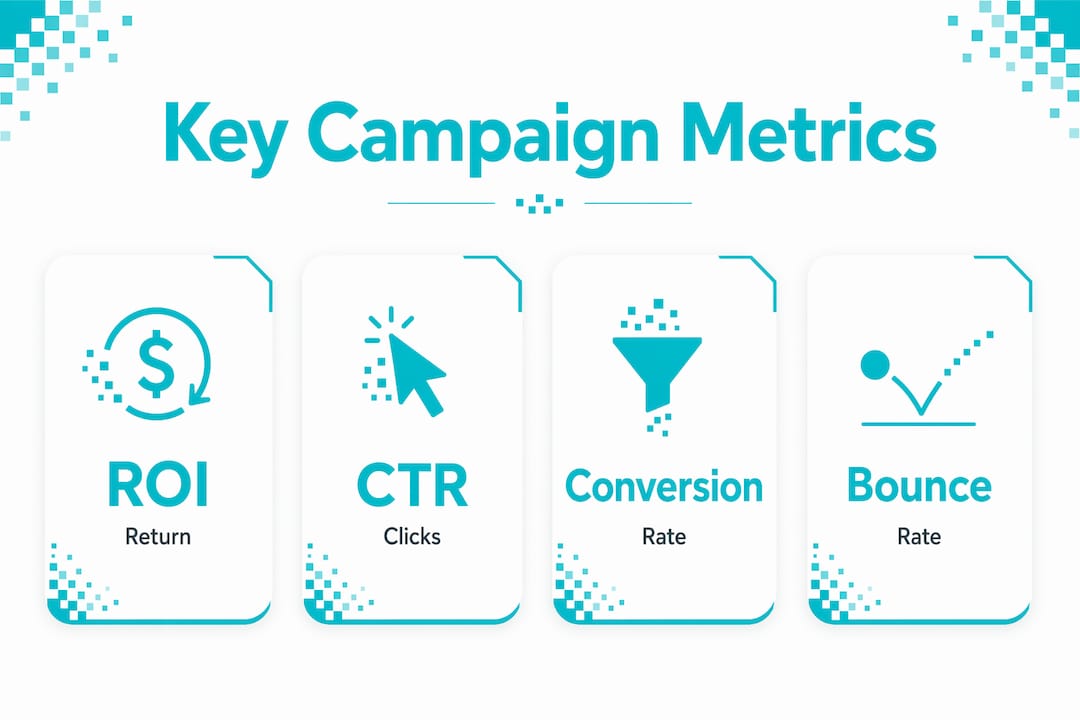
- ROI: HubSpot's ROI formula is ((Attributed Revenue − Total Campaign Spend) / Total Campaign Spend) × 100. A positive number means the campaign returned more than it cost.
- Cost per acquisition (CPA): Total spend divided by the number of new customers. Lower CPA signals more efficient spending.
- Return on ad spend (ROAS): Revenue generated per dollar of ad spend. Useful for channel comparisons, but read the caution below.
Conversion metrics show how well your funnel works:
- Conversion rate: The percentage of visitors who complete a desired action. A low rate points to a landing page or offer problem, not always a traffic problem.
- Marketing qualified leads (MQLs): Leads that meet your pre-defined criteria for sales readiness. Tracking MQLs separates real pipeline from noise.
Engagement metrics reveal audience relevance:
- Click-through rate (CTR): Measures ad or email relevance. A high CTR with low conversion usually means a weak landing page.
- Bounce rate: High bounce rates on campaign landing pages signal a mismatch between the ad promise and the page content.
| Metric type | Metric | What it tells you |
|---|---|---|
| Financial | ROI | Net return on total campaign investment |
| Financial | CPA | Efficiency of spend per new customer |
| Financial | ROAS | Revenue generated per ad dollar |
| Conversion | Conversion rate | Funnel effectiveness at each stage |
| Conversion | MQLs | Volume of sales-ready leads produced |
| Engagement | CTR | Relevance of creative and messaging |
| Engagement | Bounce rate | Landing page and audience alignment |
Pro Tip: Pick one primary metric before the campaign launches. Teams that track seven metrics equally tend to optimize for none of them.
How to set measurement windows and define success criteria
A measurement window is the specific time frame you use to evaluate whether a campaign succeeded. Setting a time frame from 14 days to 14 months is critical to meaningful campaign evaluation. The right window depends on your sales cycle, not your reporting schedule.

Short windows work for e-commerce and direct response campaigns where purchase decisions happen within days. Longer windows are non-negotiable for complex sales. B2B SaaS campaigns typically require 60–120 days between ad spend and measurable revenue, because enterprise buyers move through multi-stage approval processes. Cutting the window short makes a successful campaign look like a failure.
Success criteria are equally important. Pre-defining a primary success metric and measurement window before launch prevents post-rationalization and improves accountability. Post-rationalization is the habit of picking the metric that looks best after the results come in. It destroys credibility with finance and leadership.
Best practices for setting success criteria:
- Write down your primary KPI, secondary KPIs, and success thresholds before the campaign goes live.
- Get sign-off from finance or leadership on those thresholds. This turns measurement into a shared commitment, not a marketing exercise.
- Set a review date that matches your measurement window. Do not pull results early because a channel looks slow.
- Account for seasonality. A campaign running in november will behave differently than one running in july, even with identical creative.
Pro Tip: Document your measurement window and success threshold in the campaign brief. If it is not written down before launch, it does not count.
Which methods provide accurate, causal insights into campaign effectiveness?
Standard platform metrics are a starting point, not a finish line. Platform-reported ROAS often overstates true campaign impact. Ad platforms attribute conversions to themselves even when the customer would have purchased without seeing the ad. This is the attribution inflation problem, and it affects every major ad platform.
Incrementality testing
Incrementality testing measures the lift a campaign creates above what would have happened anyway. You split your audience into an exposed group and a holdout group, then compare conversion rates. The difference is the true incremental impact. Incrementality testing and geo-experiments reveal causal impact beyond attributed conversions, which is the number that actually matters for budget decisions.
Geo-lift experiments
Geo-lift experiments run a campaign in selected geographic markets while holding others back as a control. This method works well for TV, out-of-home, and digital campaigns where you cannot easily split individual users. The geographic control group gives you a clean baseline.
Marketing mix modeling (MMM)
MMM uses statistical regression to attribute revenue across all channels, including offline ones. It does not rely on cookies or pixel tracking, which makes it resilient to privacy changes. MMM is best suited for brands with at least 12 months of historical spend data across multiple channels.
| Method | Best for | Data requirement |
|---|---|---|
| Incrementality testing | Digital campaigns with large audiences | Audience split capability |
| Geo-lift experiments | Broad reach campaigns, offline media | Regional spend data |
| Marketing mix modeling | Multi-channel brands, long-term planning | 12+ months of spend history |
| Last-click attribution | Quick directional reads only | Standard platform data |
Using an incrementality scoreboard to track incremental revenue per channel increases credibility during budget decisions and outperforms reliance on ROAS alone. A scoreboard format lets you compare channels on the same causal basis, which makes budget conversations with leadership far more defensible.
Pro Tip: Run a holdout test on your highest-spend channel first. The result will either confirm your spend or free up budget for channels that actually drive lift.
You can see how leading brands apply these methods by reviewing successful campaign examples from 2026 that combine causal measurement with clear reporting.
How to communicate campaign results to different stakeholders
Reporting is where measurement either creates trust or loses it. Most marketing teams make one report and send it to everyone. That approach fails because a CFO and a paid search manager need completely different information.
Two-tiered reporting solves this: use financial metrics for CFOs and boards, and use platform metrics for internal teams. Executives care about revenue, pipeline contribution, and cost efficiency. Internal teams need CTR, quality score, frequency, and conversion rate by creative. Mixing these audiences into one report confuses both.
Translating technical metrics into financial language is the skill most marketing teams underinvest in. "We generated 4,200 MQLs" means little to a board. "We generated $2.1 million in qualified pipeline at a cost of $180 per lead" lands differently. The underlying data is the same. The framing changes the conversation.
Interactive, real-time dashboards with commenting capabilities improve stakeholder engagement and make reports feel collaborative rather than static. Static PDFs sent by email invite passive consumption. A live dashboard with annotations invites questions and discussion, which builds confidence in the data.
Practical reporting principles:
- Lead every executive report with the primary KPI result versus the pre-agreed threshold.
- Show trend lines, not just point-in-time numbers. A single data point has no context.
- Include a one-paragraph interpretation of what the results mean for next quarter's budget.
- Keep executive summaries to one page. Appendices can hold the detail.
Collaborative reporting with real-time dashboards increases stakeholder trust in marketing performance data. Trust is the currency that gets marketing budgets approved.
Key takeaways
Accurate campaign measurement requires pre-defined KPIs, causal testing methods, and tiered reporting that connects marketing results to financial outcomes.
| Point | Details |
|---|---|
| Define metrics before launch | Pre-agree on your primary KPI and success threshold to prevent post-rationalization. |
| Match window to sales cycle | B2B campaigns need 60–120 days; e-commerce campaigns can close in 14 days. |
| Go beyond platform ROAS | Use incrementality testing or geo-lift experiments to measure true causal impact. |
| Report by audience | Use financial language for executives and platform metrics for internal teams. |
| Build an incrementality scoreboard | Tracking incremental revenue per channel makes budget decisions defensible and credible. |
What I have learned about measurement after years of watching campaigns fail
The most common measurement failure I see is not a tool problem. It is a timing problem. Teams launch a campaign, check results after two weeks because leadership is impatient, declare it underperforming, and pull the budget. Then a competitor running the same strategy with a 90-day window reports a strong ROI. The campaign was not the problem. The measurement window was.
The second failure is blind trust in platform data. Every major ad platform has a financial incentive to show you a high ROAS. That does not mean the number is wrong, but it does mean you should verify it. Geo-lift tests and holdout groups are not exotic techniques reserved for enterprise brands. Any team running meaningful ad spend can run a basic holdout test within their existing platform settings.
What actually works in 2026 is a combination of pre-defined metrics, causal testing, and financial-language reporting. Teams that do all three get budgets approved faster and face fewer post-campaign interrogations. The credibility that comes from saying "here is what we predicted, here is what happened, and here is the causal proof" is worth more than any dashboard feature.
The marketers who struggle most are the ones who measure everything and commit to nothing. Pick your primary metric. Defend it before the campaign launches. Then let the data speak.
— Matthew
How Viralmarketingstudio supports your campaign measurement
Knowing what to measure is one thing. Having the systems to capture, analyze, and report that data consistently is another challenge entirely.

Viralmarketingstudio builds analytics-driven marketing systems that connect campaign activity to business outcomes. From automated performance dashboards to custom reporting workflows, the team designs solutions that give marketing professionals and business owners the visibility they need to make confident budget decisions. Whether you need a measurement framework built from scratch or a reporting layer added to existing campaigns, Viralmarketingstudio delivers the infrastructure that turns data into decisions.
FAQ
What is marketing campaign performance measurement?
Marketing campaign performance measurement is the process of tracking specific metrics, such as ROI, conversion rate, and CPA, to determine whether a campaign achieved its defined business goals.
How do you calculate ROI for a marketing campaign?
HubSpot's ROI formula is ((Attributed Revenue − Total Campaign Spend) / Total Campaign Spend) × 100. A result above zero means the campaign returned more than it cost.
How long should a campaign measurement window be?
Measurement windows range from 14 days to 14 months depending on the sales cycle. B2B campaigns typically need 60–120 days to show accurate revenue results.
What is incrementality testing in marketing?
Incrementality testing compares conversion rates between an audience exposed to a campaign and a holdout group that was not. The difference reveals the true causal lift the campaign created, separate from organic demand.
Why is platform-reported ROAS unreliable on its own?
Platform-reported ROAS overstates true impact because platforms attribute conversions to themselves even when the customer would have purchased without the ad. Causal methods like geo-lift tests provide a more accurate picture.